Source: The World Bank (World Development Indicators),
Food and Agriculture Organization, AQUASTAT data.
International Energy Agency, World Energy Outlook 2010.
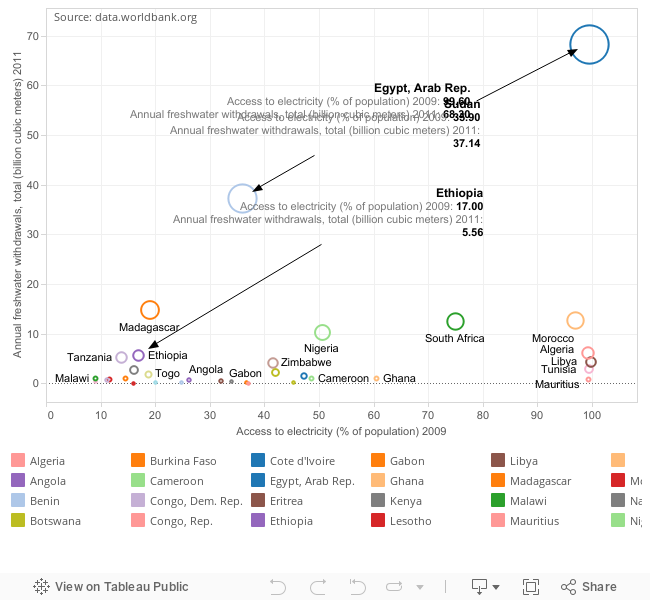
Annual freshwater withdrawals, total (billion cubic meters)
Annual freshwater withdrawals refer to total water withdrawals, not counting evaporation losses from storage basins. Withdrawals also include water from desalination plants in countries where they are a significant source. Withdrawals can exceed 100 percent of total renewable resources where extraction from nonrenewable aquifers or desalination plants is considerable or where there is significant water reuse. Withdrawals for agriculture and industry are total withdrawals for irrigation and livestock production and for direct industrial use (including withdrawals for cooling thermoelectric plants). Withdrawals for domestic uses include drinking water, municipal use or supply, and use for public services, commercial establishments, and homes. Data are for the most recent year available for 1987-2002.
data.worldbank.org/indicator/ER.H2O.FWTL.K3
Access to electricity (% of population)
Access to electricity is the percentage of population with access to electricity. Electrification data are collected from industry, national surveys and international sources.
data.worldbank.org/indicator/EG.ELC.ACCS.ZS
Food and Agriculture Organization, AQUASTAT data.
International Energy Agency, World Energy Outlook 2010.
Annual freshwater withdrawals, total (billion cubic meters)
Annual freshwater withdrawals refer to total water withdrawals, not counting evaporation losses from storage basins. Withdrawals also include water from desalination plants in countries where they are a significant source. Withdrawals can exceed 100 percent of total renewable resources where extraction from nonrenewable aquifers or desalination plants is considerable or where there is significant water reuse. Withdrawals for agriculture and industry are total withdrawals for irrigation and livestock production and for direct industrial use (including withdrawals for cooling thermoelectric plants). Withdrawals for domestic uses include drinking water, municipal use or supply, and use for public services, commercial establishments, and homes. Data are for the most recent year available for 1987-2002.
data.worldbank.org/indicator/ER.H2O.FWTL.K3
Access to electricity (% of population)
Access to electricity is the percentage of population with access to electricity. Electrification data are collected from industry, national surveys and international sources.
data.worldbank.org/indicator/EG.ELC.ACCS.ZS
 RSS Feed
